
Equities endured a tough 2022, as a litany of concerns, including high oil prices, Russia’s invasion of Ukraine, rising interest rates and elevated inflation plagued investors.i Based on Fisher Investments UK’s review of financial commentary, these factors drove fear up and equities down for long stretches during the year.ii Whilst European equities suffered corrections, returns in US dollars breached -20%, meeting a common definition of a bear market – colouring how financial commentators treat the decline.iii But global equities have irregularly rallied since June’s lows – and begun 2023 positively, too.iv However, some financial publications we follow warn the rally isn’t sustainable and point to any bout of volatility as evidence of weakness. Fisher Investments UK’s review of market history shows market recoveries aren’t smoothly positive – a reality worth keeping in mind, in our view.
Based on Fisher Investments UK’s reviews of financial publications, dour moods often linger in headlines during bear markets and well into new bull markets (long periods of generally rising equity prices). Commentators we follow often warn of a proverbial second shoe to drop that will send equities to new lows, rendering the rally a false dawn – and treat any volatility that surfaces as confirmation that the bad times have indeed returned. In Fisher Investments UK’s experience, investors – still scarred by the pain of the bear market – can be quite vulnerable to this mentality. After a partial recovery, it can seem like an attractive exit point ahead of worse to come. We have also long observed a psychological tendency to fight the past war, which would naturally lead investors to treat any negativity during a recovery’s early days as a possible extension of the prior bear market.
It is true, based on Fisher Investments UK’s review of equity market history, that some bear markets include temporary rallies before falling to new lows. They can last for weeks or even months. Yet per Fisher Investments UK’s review of new bull markets, it is also common for short bursts of negative volatility to strike in the first year of bull markets – without sending equities to new depths. See the bull market that began in March 2003. (Exhibit 1) In that recovery’s early days, global equities fell -5.7% as uncertainty stirred over a potential American invasion of Iraq.v But the start of war didn’t derail markets, which were up 33.7% by yearend.vi
Exhibit 1: MSCI World, 2002 – 2007
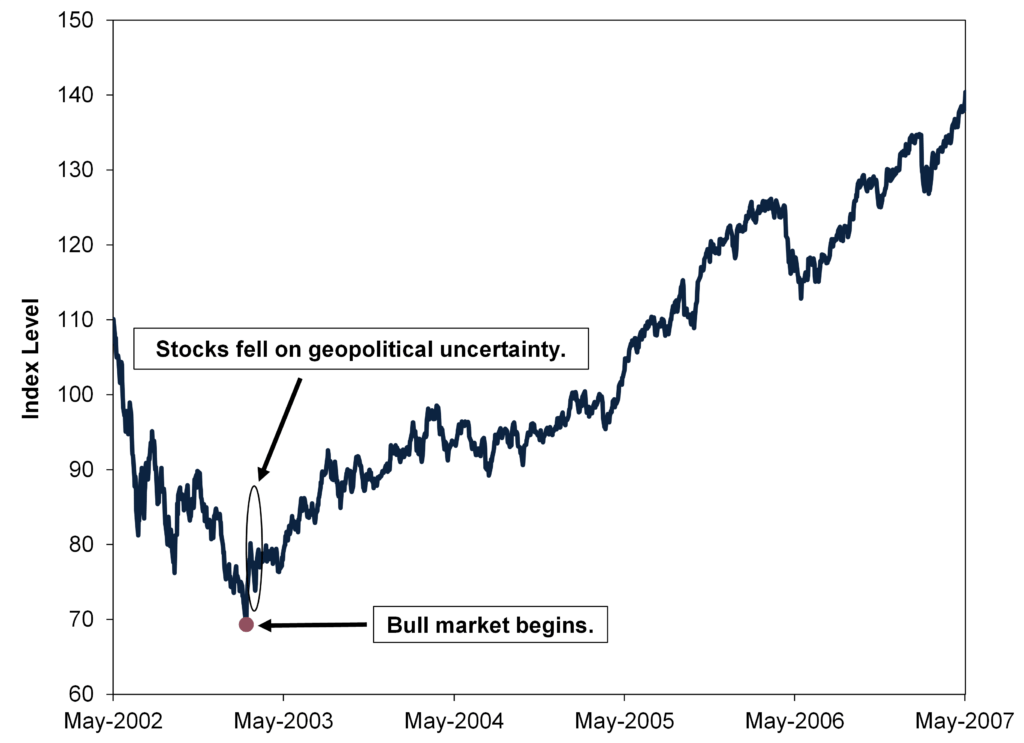
Source: FactSet, as of 13/2/2023. MSCI World Index return with net dividends, 31/5/2002 – 31/5/2007.
Or consider the bull market that started in 2009. From its birth on 6 March through yearend, equities rose 50.4%.vii Yet that ascent wasn’t smooth, either. Global equities dipped -9.6% in the summer, as our review of financial publications at the time suggested concerns about the global economy, high unemployment and the H1N1 swine flu dinged sentiment.viii Volatility later in the year accompanied Dubai’s debt crisis, which many headlines we saw at the time warned could ripple globally. It didn’t, and those who held equities through the scary headlines and rocky times benefitted, in our view.
Exhibit 2: MSCI World, 2008 – 2013
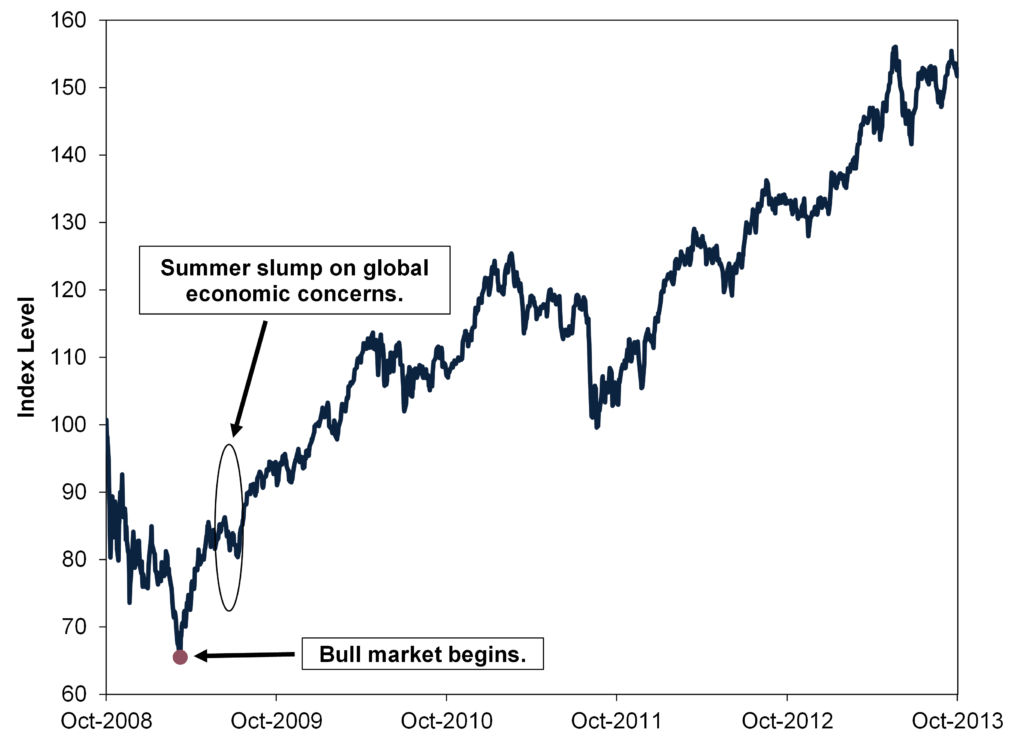
Source: FactSet, as of 13/2/2023. MSCI World Index return with net dividends, 1/10/2008 – 1/10/2013.
Finally, recall three years ago, when global equities rose 44.3% from the end of the COVID-driven bear market through yearend.ix This surge also wasn’t linear. In October markets fell about -6.0% as European nations reinstated some COVID restrictions – sparking concerns of renewed lockdowns.x That sentiment-driven dip didn’t prevent equities from ending the year higher, nor did it end the bull market.xi
Exhibit 3: MSCI World, 2018 – 2023
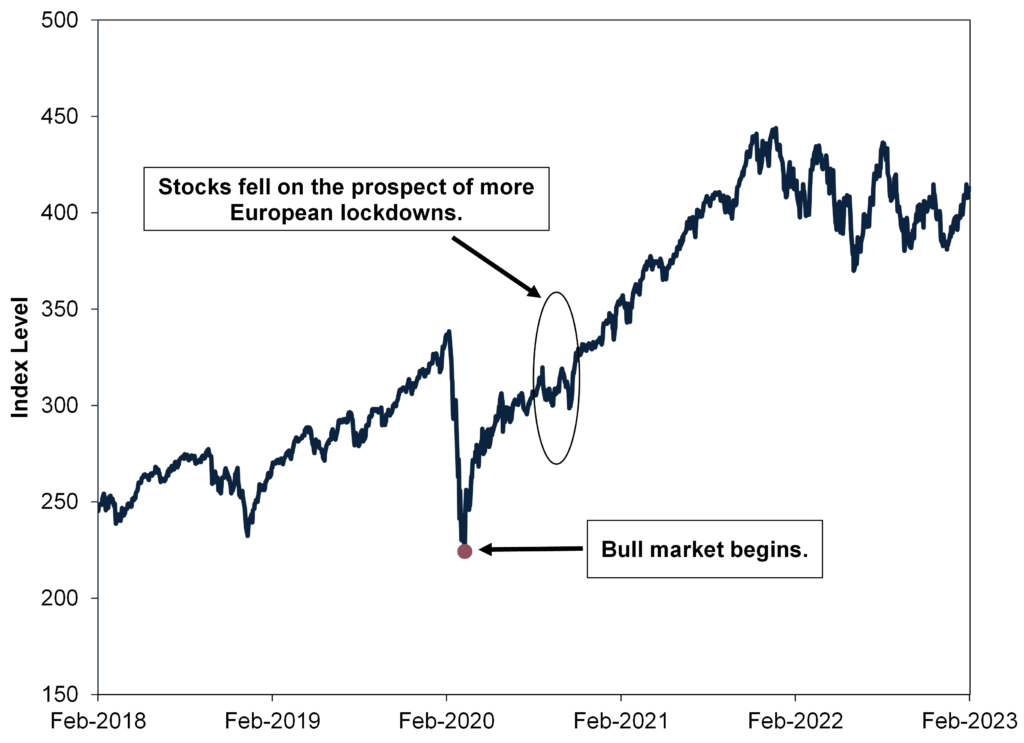
Source: FactSet, as of 13/2/2023. MSCI World Index return with net dividends, 14/2/2018 – 14/2/2023.
Market recoveries aren’t smooth: they dip, jump and experience flat stretches. But those short-term bumps don’t prevent equities from rising over the longer term, which is helpful perspective for investors, in Fisher Investments UK’s view.
Interested in other topics by Fisher Investments UK? Get our ongoing insights, starting with a copy of Markets Commentary.
Follow the latest market news and updates from Fisher Investments UK:
ii Source: FactSet, as of 15/2/2023. Statement based on the MSCI World Index return with net dividends, which declined -16.7% between 4/1/2022 and 16/6/2022 in euros. Currency fluctuations between pounds and other currencies may result in higher or lower investment returns.
iii Ibid. Statement based on the MSCI World Index return with net dividends in dollars, 4/1/2022 – 16/6/2022. A correction is typically a sentiment-driven decline of -10% to -20%. A bear market is typically a longer decline worse than -20% with a fundamental cause. Currency fluctuations between the dollar and other currencies may result in higher or lower investment returns.
iv Ibid. Statement based on the MSCI World Index return with net dividends in pounds, 16/6/2022 – 14/2/2023.
v Ibid. MSCI World Index return with net dividends, 21/3/2003 – 31/3/2003.
vi Ibid. MSCI World Index return with net dividends, 12/3/2003 – 31/12/2003.
vii Ibid. MSCI World Index return with net dividends, 6/3/2009 – 31/12/2009.
viii Ibid. MSCI World Index return with net dividends, 8/5/2009 – 10/7/2009.
ix Ibid. MSCI World Index return with net dividends, 16/3/2020 – 31/12/2020.
x Ibid. MSCI World Index return with net dividends, 13/10/2020 – 28/10/2020.
xi Ibid. MSCI World Index return with net dividends, 23/3/2020 – 13/2/2023.