
Is a global recession lurking behind 2018’s volatility? Our survey of financial media publications suggests many believe so, seeing slowdowns in some economic data as evidence. But whilst recession fears may have risen, a look at a broad swath of data doesn’t support them, in our view. Overall, we think the picture they paint shows the global economy holding up much better than popularly portrayed. Here are seven charts to help illustrate this point.
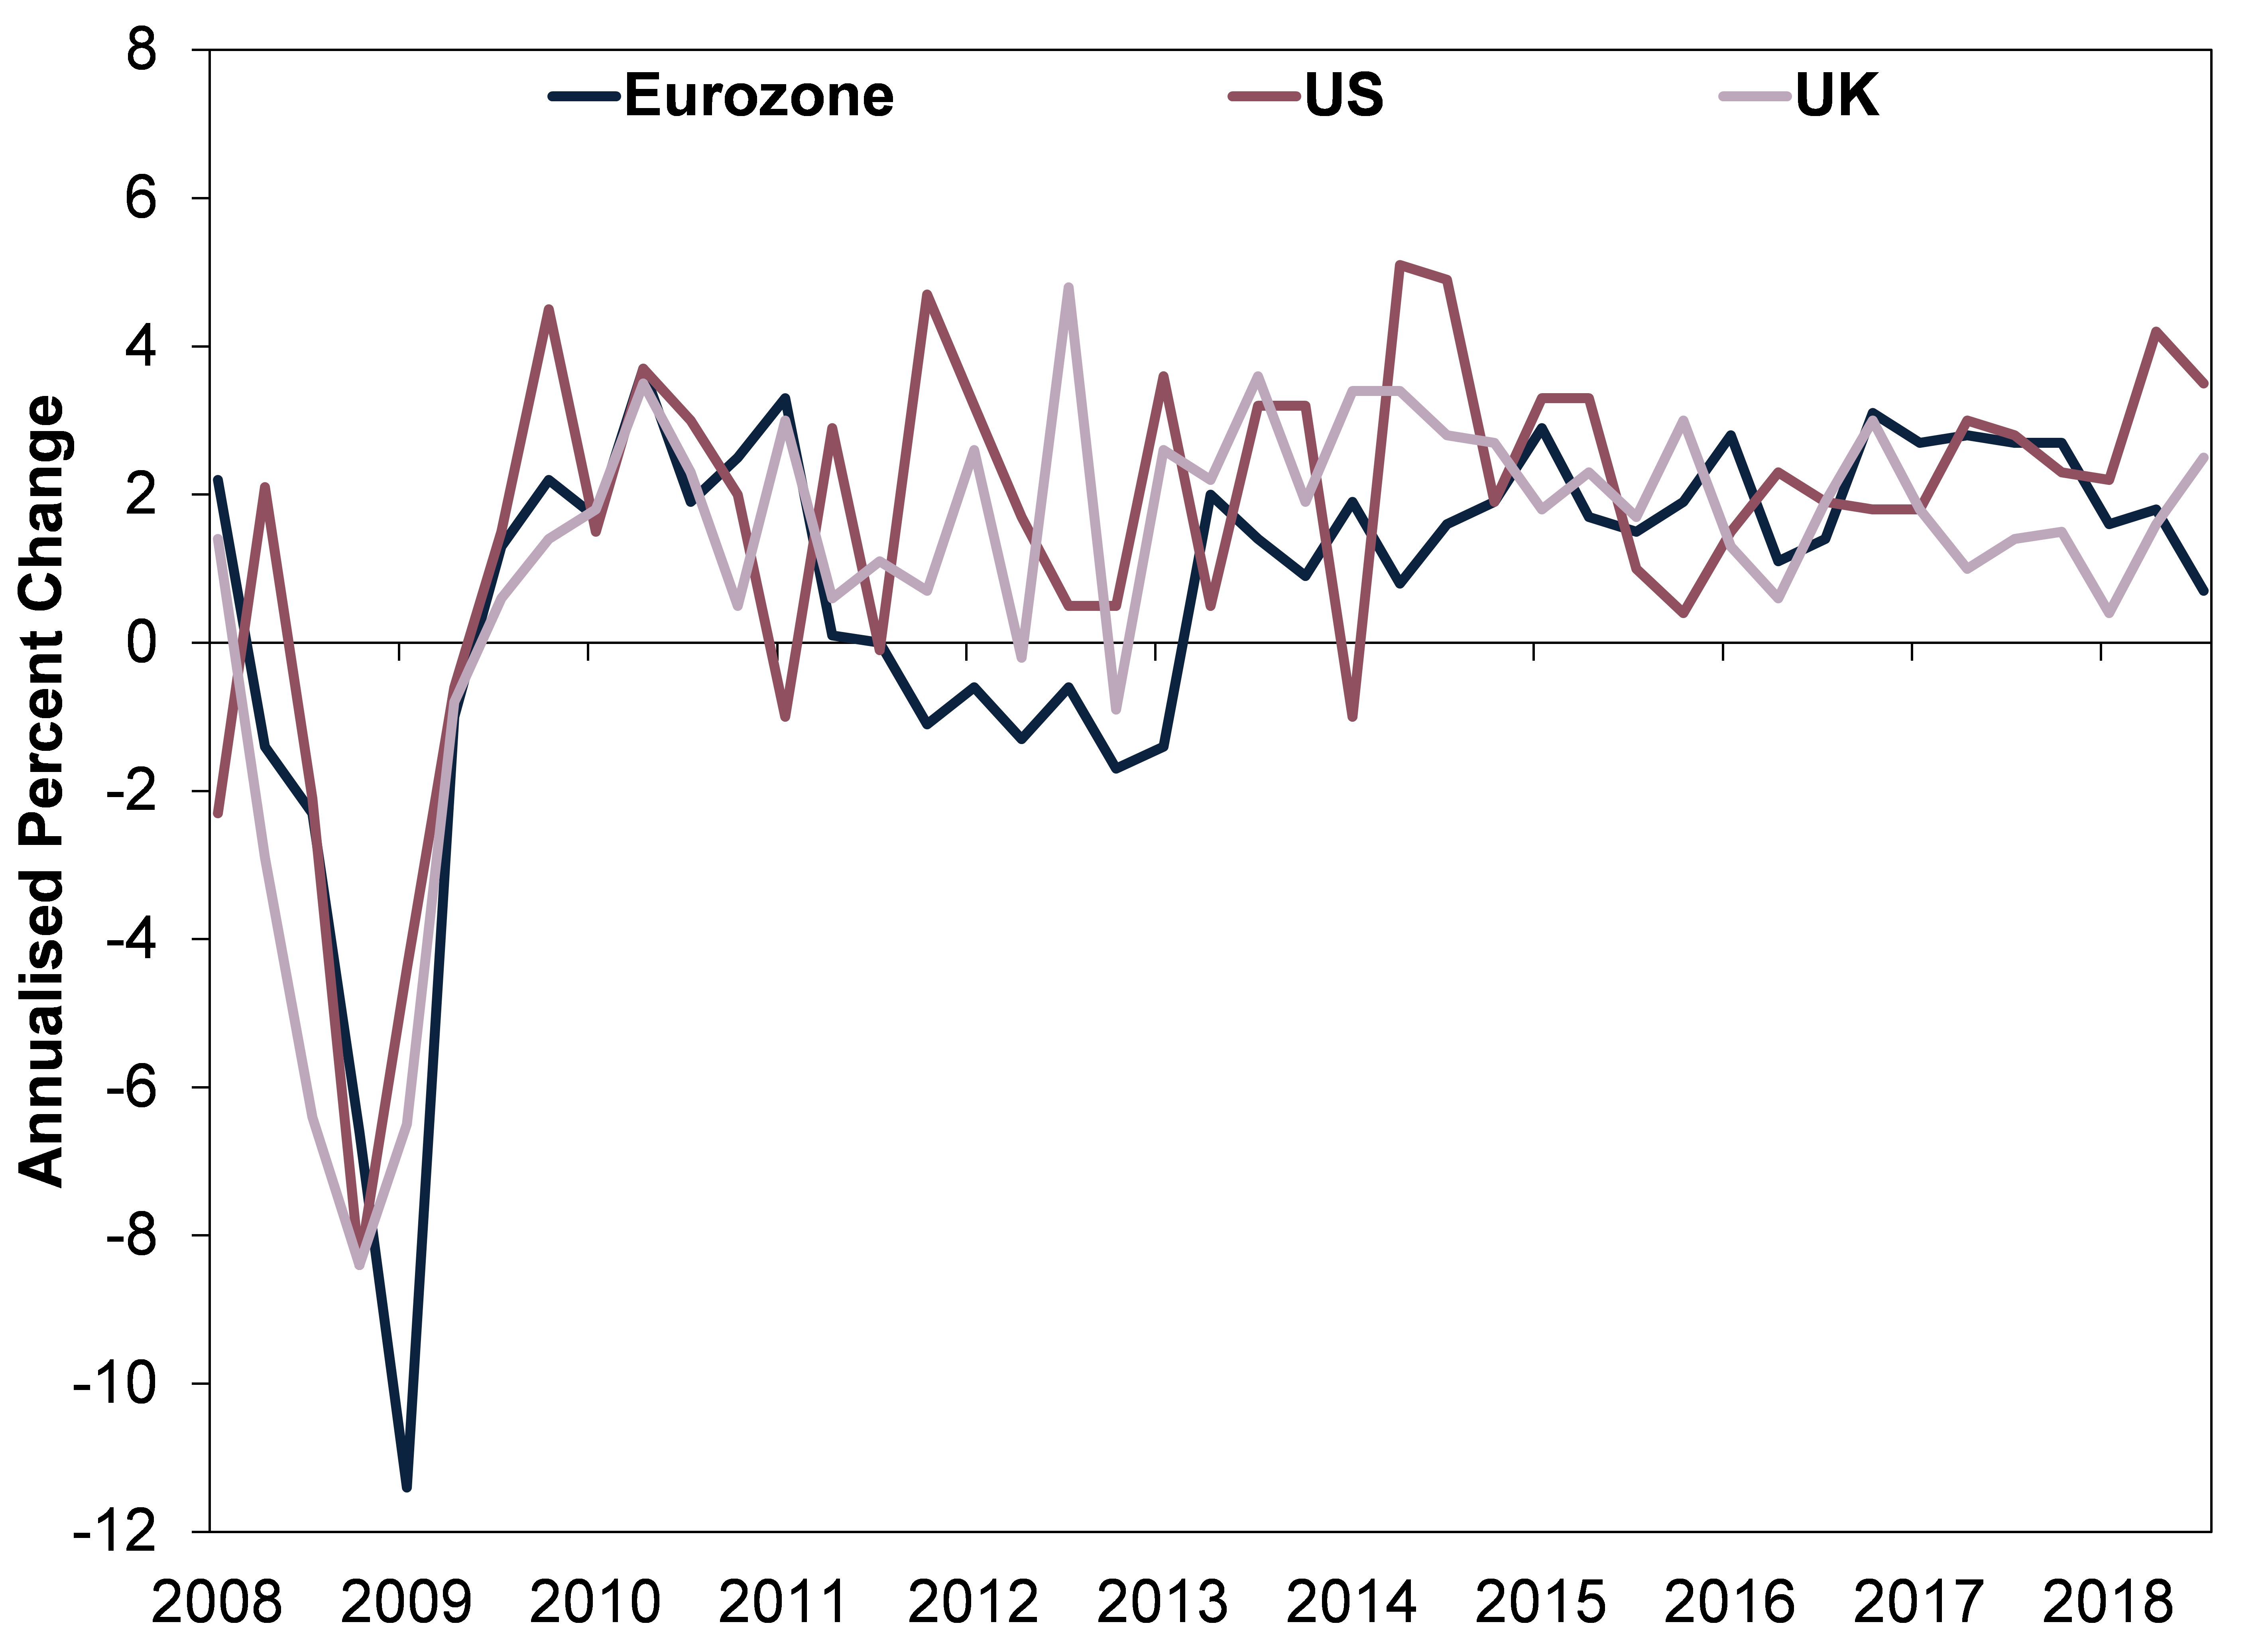
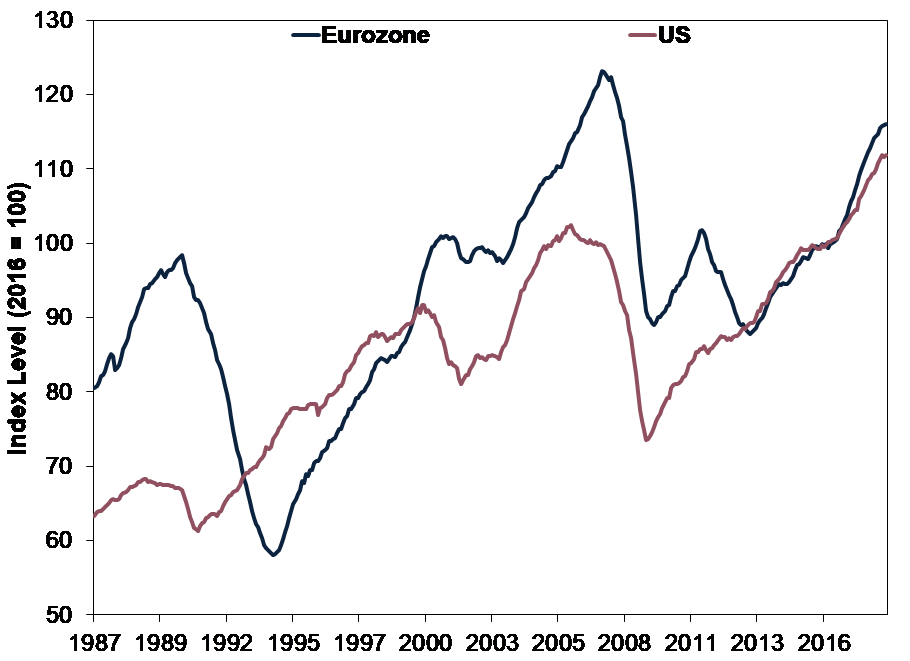
Whilst the data is backward looking, gross domestic product (GDP)—a government-produced estimate of national economic output—for most of the developed world entered Q4 growing. Exhibit 1 plots three major world economies’ GDPs to illustrate this point. The eurozone’s GDP growth may be slower, but we believe this is mostly due to the auto industry’s struggles to comply with new emissions testing standards—a temporary one-off. Further, growth rates often ebb and flow in expansions and bull markets—something Exhibit 1 also illustrates. There isn’t necessarily anything abnormal about slower growth.
Exhibit 1: GDP Growing Globally
Fears also abound over alleged trade wars, but trade globally is chugging along. Global trade volumes remain in an upward—if choppy—trend. In our view, tariffs enacted and threatened lack the heft to derail global growth, which Exhibit 2 helps demonstrate.
Exhibit 2: Global Trade Rising
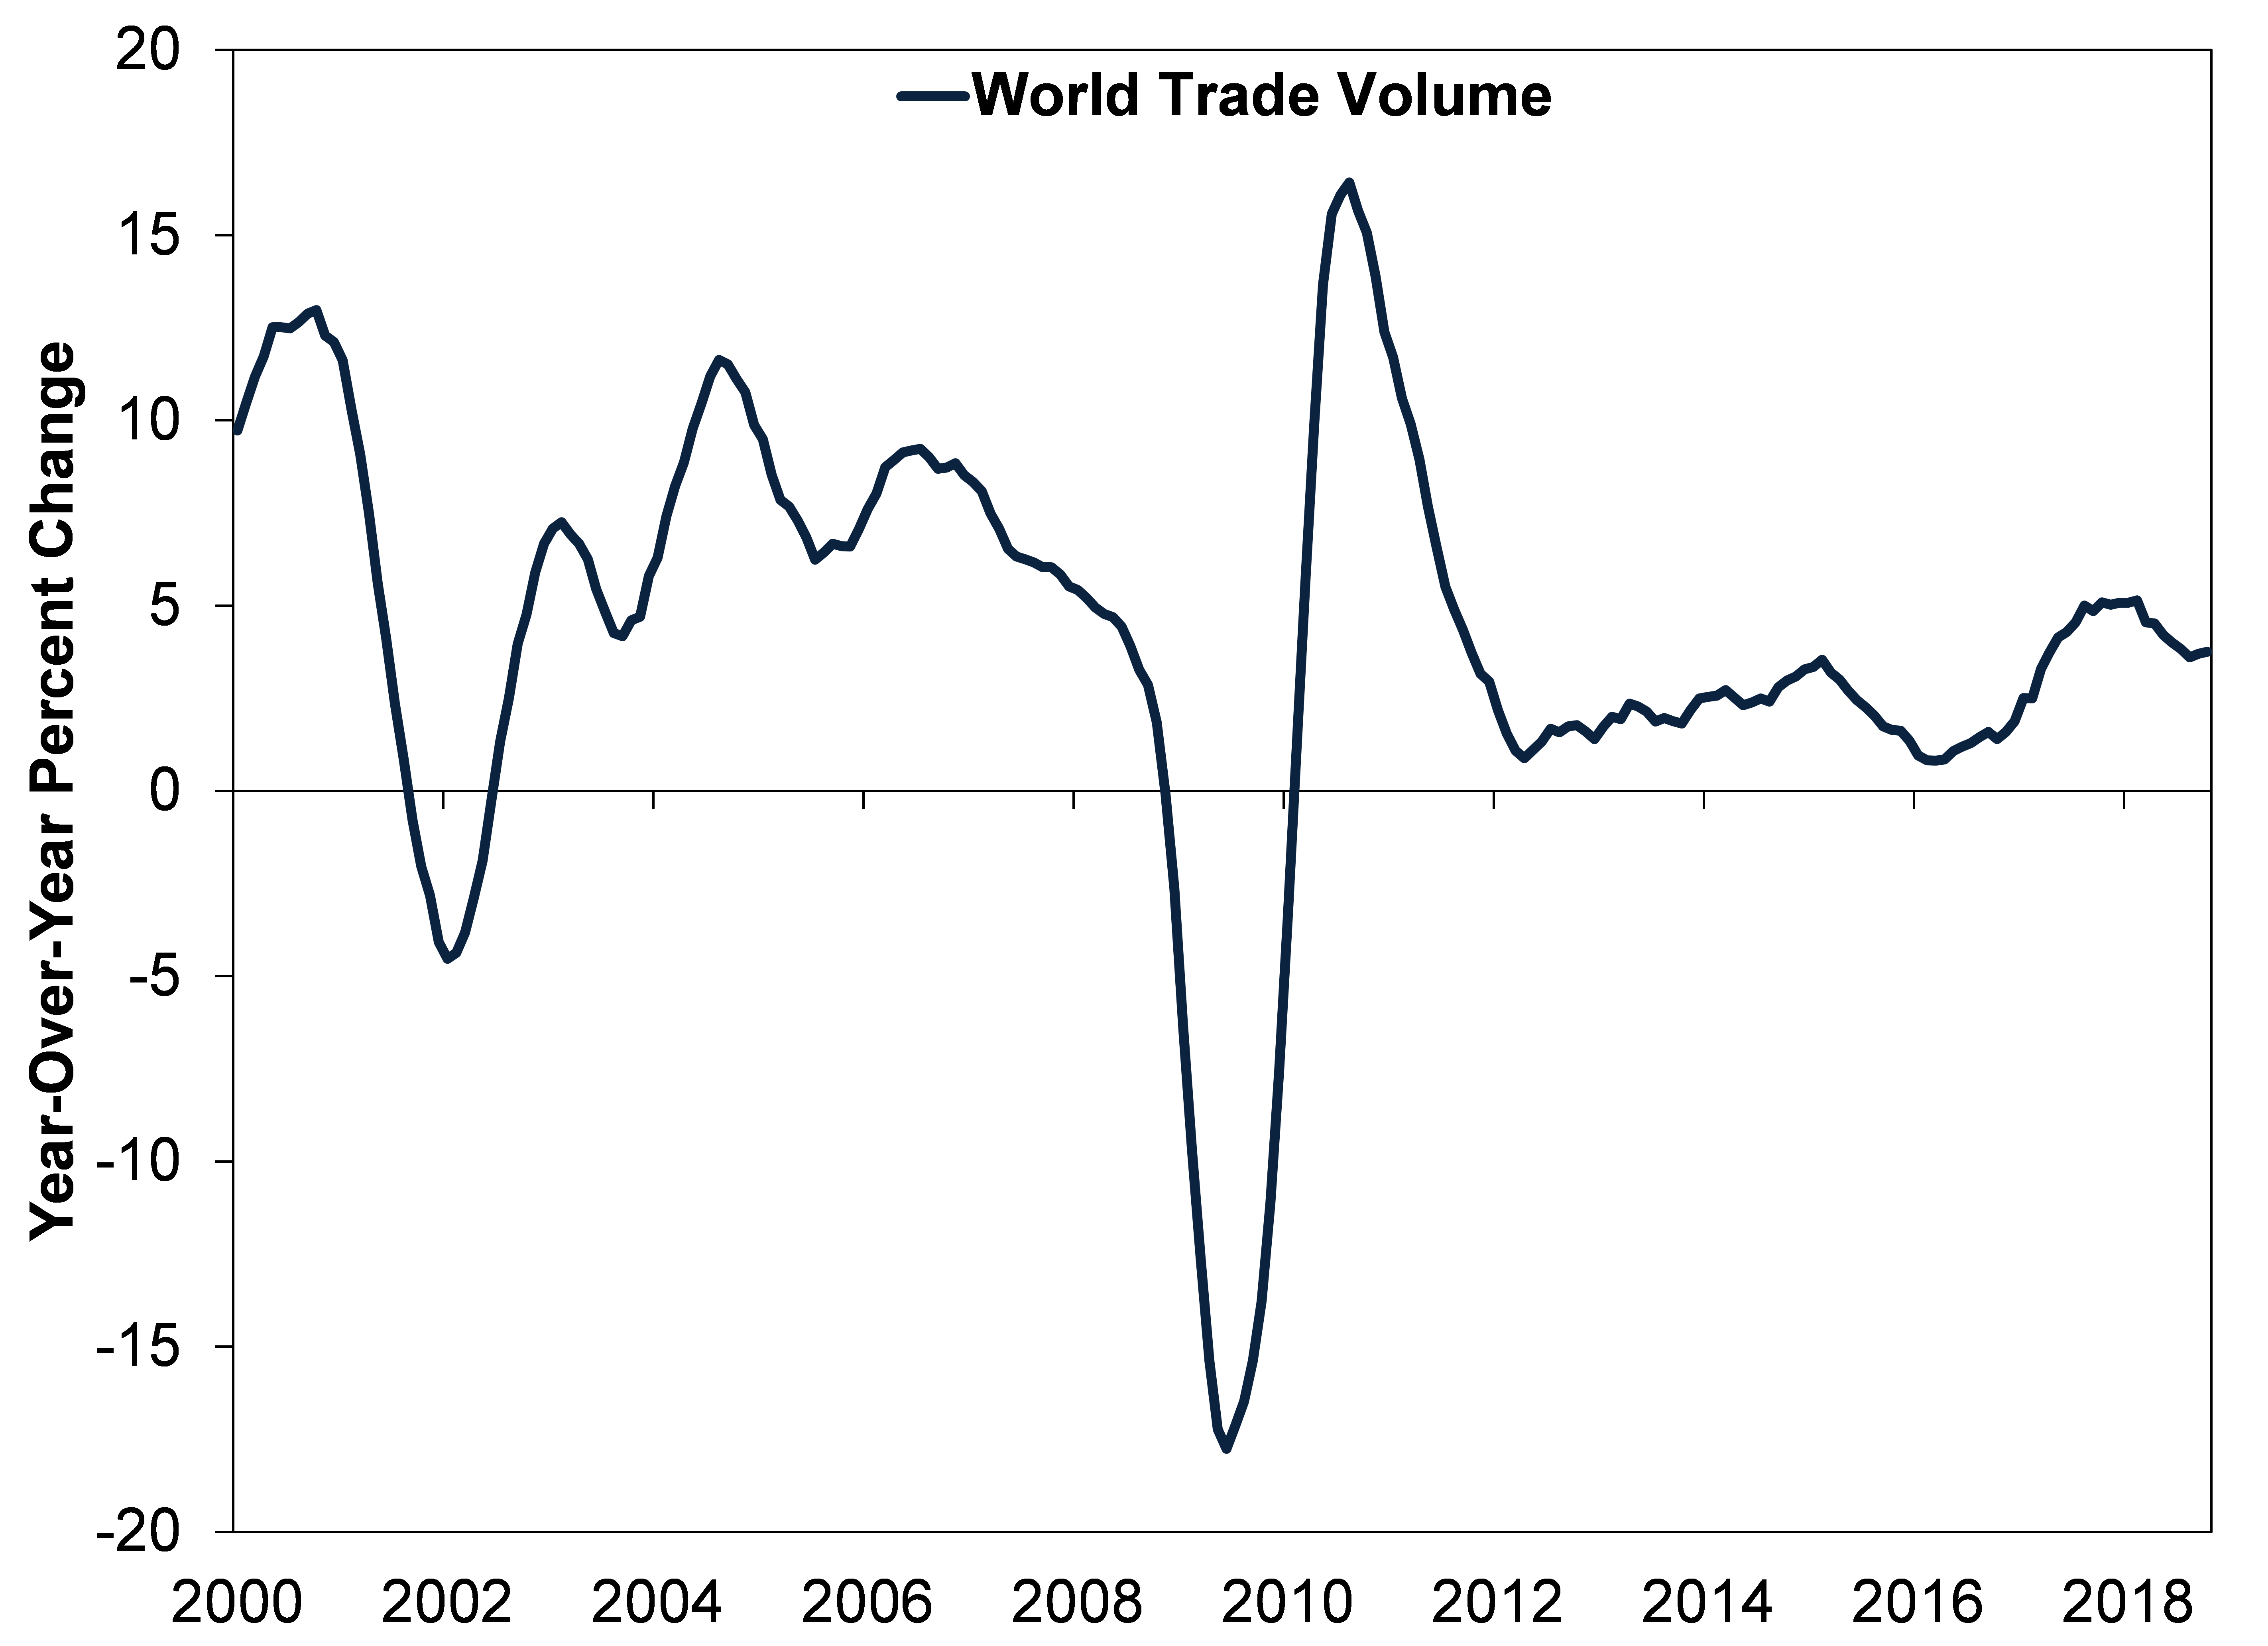
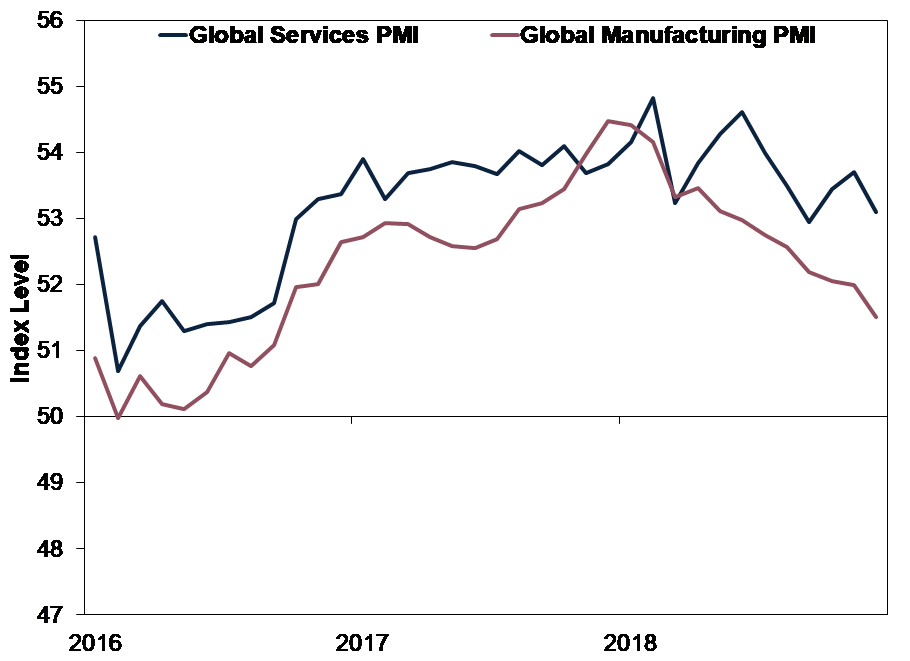
Exhibit 3 shows global purchasing managers’ indexes (PMIs)—surveys estimating the percentage of businesses that grew in a given month—remain above 50, suggesting more than half of companies responding grew throughout Q4. That generally indicates expansion, according to PMIs’ traditional methodology. Positive new orders suggest more ahead. Whilst PMIs do not have a perfect tie to GDP because they measure growth’s breadth without regard to its magnitude, this is evidence not all data was negative even during Q4’s equity market volatility. And whilst global PMIs’ downtick since early 2018 does show fewer firms report growth than at 2018’s start, the majority still do. In December, both manufacturing and services gauges topped levels seen in 2016, a time the global economy grew fine.
Exhibit 3: Global PMIs Above 50, Indicating Expansion
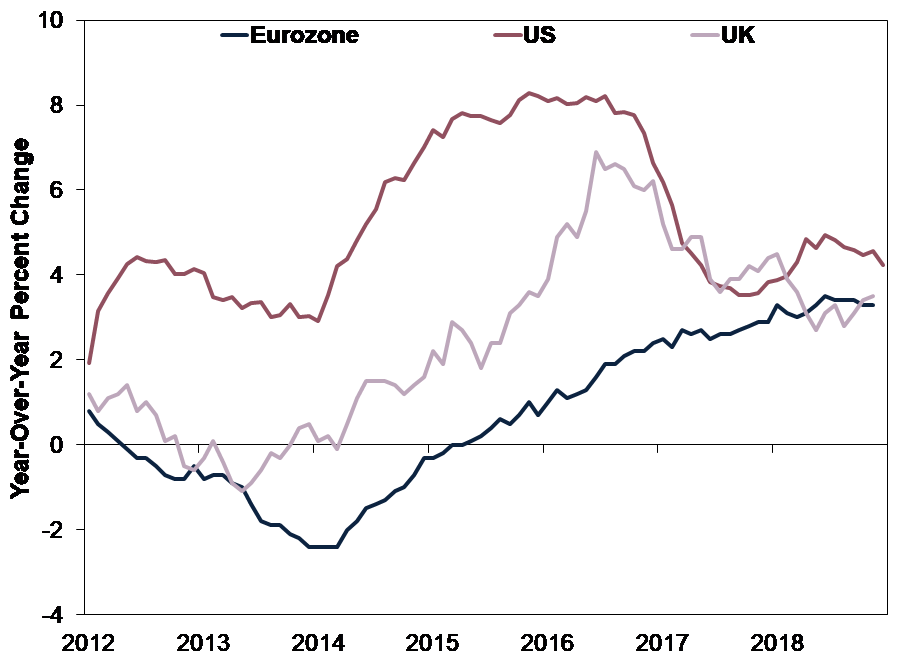
Looking ahead, we see steady global loan growth, which we think is a forward-looking indicator, backing private demand. Exhibit 4 shows 3.3% y/y and 3.5% November loan growth in the eurozone and UK, respectively, and 4.2% y/y loan growth in the US for December. Whilst perhaps not quite as rapid in recent years for the US and UK, loan growth remains positive overall—in our view, rising demand for and access to credit should continue driving broad economic growth.
Exhibit 4: Private Sector Loan Growth Is Positive
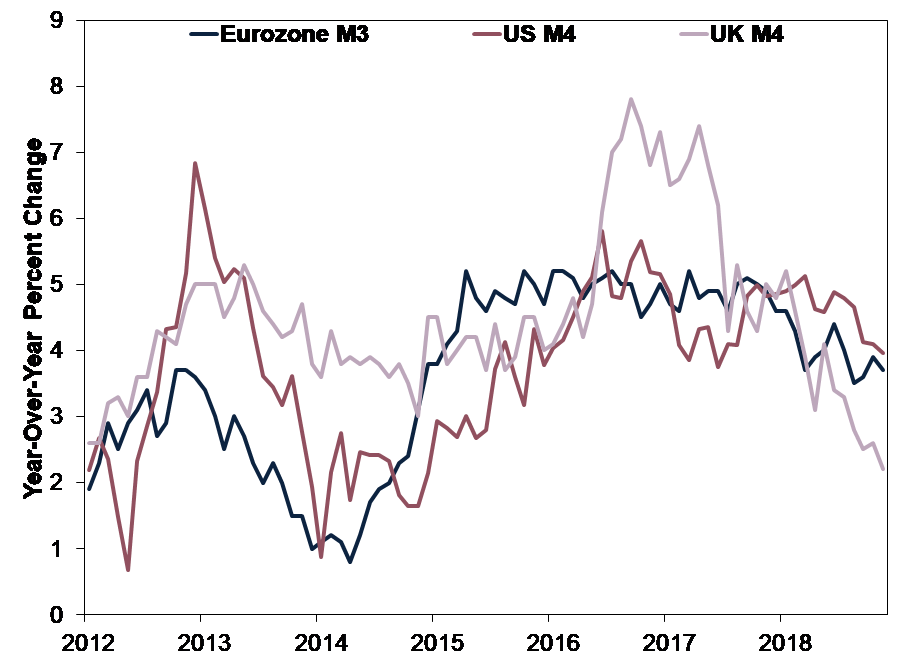
Lending drives money supply, a major influence on future economic growth. Broad money supply measures in major economies show good growth through November—3.7% y/y in the eurozone, 2.2% in the UK and 4.0% in the US. (Exhibit 5) Positive money supply growth indicates capital is circulating to households and businesses—good for future economic activity—supporting global expansion.
Exhibit 5: Broad Money Supply Expanding
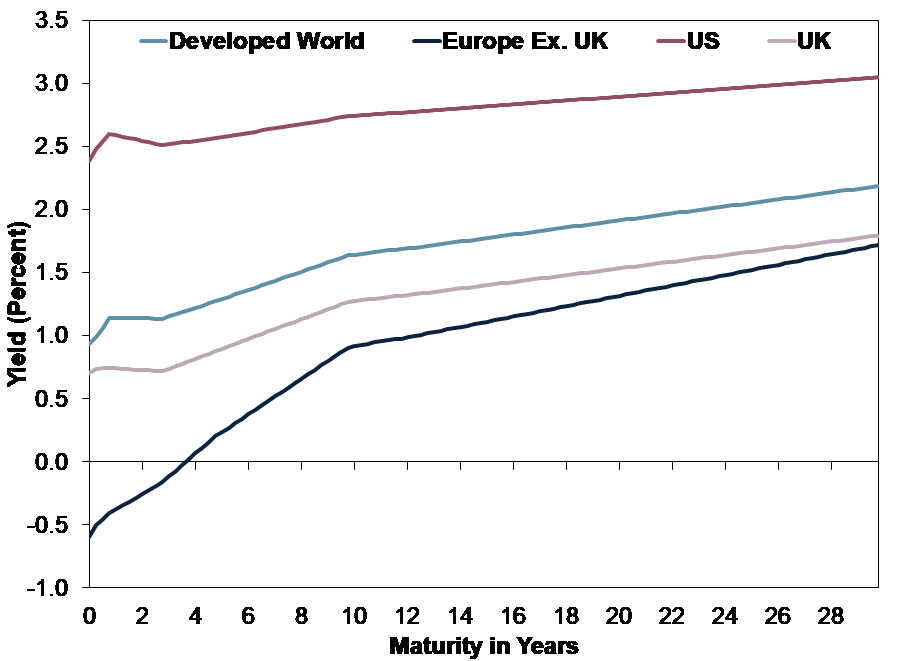
Around the world, yield curves—which chart the difference between short-term and long-term government bond yields—slope upwards, with long rates exceeding short. We think this usually signals financial conditions fundamentally support global bull markets and expansions. Since banks borrow at short rates and lend at long rates, a positively sloped yield curve shows lending is generally profitable, which spurs loan growth and economic expansion. More important than any individual country’s yield curve, the global yield curve (light blue line in Exhibit 6) is positively sloped. Many financial firms can easily borrow in one country and lend in another, hedging for currency swings. Hence, we think the global yield curve is paramount to the world financial system’s health. Today, fuel for ongoing global economic growth seems likely to be plentiful, in our view.
Exhibit 6: Global Yield Curves Slope Upwards
The Conference Board’s Leading Economic Indexes (LEI) for the eurozone and US are both high and rising. These gauges blend together an array of mostly forward-looking economic indicators—a handy tool for investors, in our view. The growth outlook for the world’s two largest economies is positive. In the nearly 60-year history of the US LEI, no recession has hit without a months-long LEI downtrend preceding it.i This is strong evidence a recession isn’t lurking, in our view.
Exhibit 7: Eurozone and US LEIs High and Rising
So in sum: In a large swath of the global economy, credit looks to be flowing, business activity seems to be expanding and leading indicators suggest further growth. Given all this and more, we think the global economic outlook appears solid—far brighter than widespread recession worries. Equities move most on the gap between reality and expectations, according to our analysis. Given prevailing dour sentiment in our review of the media, reality likely has a lower hurdle to positively surprise, which should fuel rising equity markets.
Interested in other topics by Fisher Investments UK? Download your free copy of Markets Commentary and receive ongoing insights.
Follow the latest market news and updates from Fisher Investments UK:
On Facebook
On Twitter
On LinkedIn
iSource: FactSet, as of 14/1/2019. Statement refers to the US LEI and recessions as defined by the National Bureau of Economic Research, the US government’s official recession dating arbiter.
Fisher Investments Europe Limited, trading as Fisher Investments UK, is authorised and regulated by the UK Financial Conduct Authority (FCA Number 191609) and is registered in England (Company Number 3850593). Fisher Investments Europe Limited has its registered office at: 2nd Floor, 6-10 Whitfield Street, London, W1T 2RE, United Kingdom.
Investment management services are provided by Fisher Investments UK’s parent company, Fisher Asset Management, LLC, trading as Fisher Investments, which is established in the US and regulated by the US Securities and Exchange Commission.
Investing in financial markets involves the risk of loss and there is no guarantee that all or any capital invested will be repaid. Past performance neither guarantees nor reliably indicates future performance. The value of investments and the income from them will fluctuate with world financial markets and international currency exchange rates.