
What drives equities in Australia? Whilst the Lucky Country may seem a world away, our investment approach is similar to markets in Europe and elsewhere. To help familiarise yourself with the lay of the investment land, here is a roadmap for equities Down Under.
With any nation, there are three key drivers Fisher Investments UK thinks determine equities’ direction: economics, politics and sentiment – specifically, how are the first two likely to impact the outlook for corporate sales and profits? And, crucially in our view, how does this relate to what investors already expect? We think markets are efficient discounters of commonly held views and widely known information, pre-pricing them into equities. Hence, the potential for surprise – the unexpected – is central to determining market cycles, in our experience.
Politically, Australia is a well-established Parliamentary democracy with many similarities to Britain. And, like many nations, trends in uncertainty are key for equities, according to Fisher Investments UK’s research. Whilst many pundits we follow get bogged down in weighing various politicians’ personalities or party’s reputations, we think the ability to legislate is central to markets. In our experience, legislation – however well-intended – usually creates winners and losers. It stokes uncertainty as rules governing business shift. To weigh the likelihood of this, one must consider the Parliament’s makeup. Is there a majority government? Minority? Coalition? To what extent is the coalition aligned? Those questions are key.
Economically, similar to developed markets globally, Australia’s economy is primarily consumption driven – household expenditures comprise the biggest part of its gross domestic product (GDP).[i] Growth here – and for GDP overall – has been historically steady, consistent with other developed economies’ trends.[ii] But Australia did have one notable claim to fame: until 2020’s pandemic lockdown-induced recession (a period of widespread economic contraction), its economic expansion ran for 28 years – the developed world’s longest postwar stretch.[iii]
GDP and equities don’t necessarily move in lockstep, though. Despite that economic growth streak, Australia endured a bear market (typically prolonged, fundamentally driven decline exceeding -20%) from 2007 – 2009.[iv] Why? Sector makeup matters, and Financials – the MSCI Australia Index’s largest sector (almost 40% of the index, nearly two-and-a-half times the global developed MSCI World’s share) – drove equities’ swoon.[v]
Whilst Australia’s Financials sector escaped the late-2000s’ global financial crisis relatively unscathed compared to other developed nations – without failures and remaining profitable – its earnings growth still plunged and relative performance alongside it.[vi] (Exhibit 1) Based on Fisher Investments UK’s review of the causes, Australia’s deeply inverted yield curve – when short-term interest rates top long rates – stands out. Yield curves can approximate banks’ new loan profitability as they typically borrow at short rates and lend at longer rates, pocketing the difference. Narrowing yield spreads from the early-2000s corresponded with Financials’ underperformance. Spreads’ deep negativity in 2007 coincided with Financials equities’ steep relative drop, presaging 2008’s earnings collapse.[vii]
Exhibit 1: A Steepening Yield Curve Helps Australian Financials – but Flattening Hurts
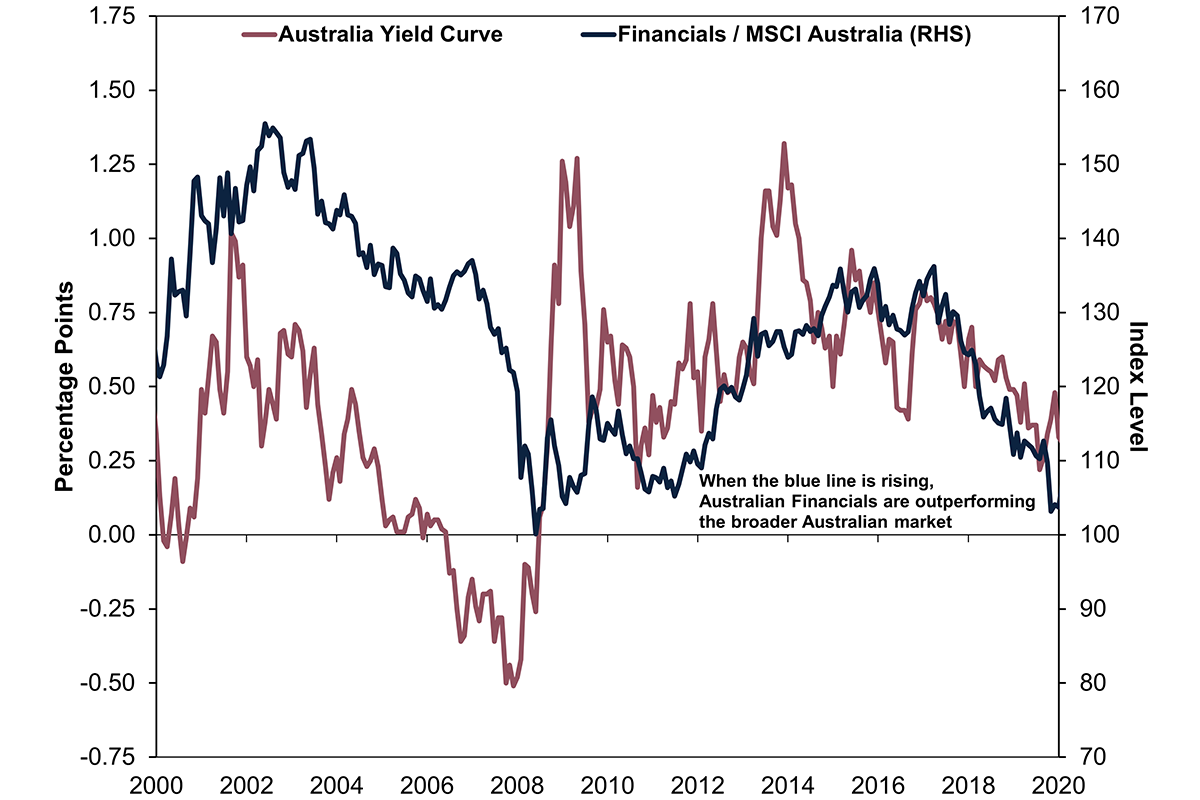
Source: FactSet, as of 15/1/2025. MSCI Australia Financials and Index returns with net dividends and 10-year minus 3-month Australia government bond yields, December 1999 – December 2019.
Another prominent driver of Australian equities, in our view: metals prices. Materials is MSCI Australia’s second-largest sector at 18 – six times the MSCI World’s 3% weight – and contains several Metals & Mining giants.[viii] Fisher Investments UK’s reviews of commodity industries find pricing drives equities – and profitability – more than volumes sold.
Exhibit 2 shows the MSCI Australia Index’s relative performance versus global markets against platinum prices, which we feature for its long history and the metal’s many industrial uses – tying it to global manufacturing demand. (Based on Fisher Investments UK’s research, other industrial metals – including iron, copper and nickel – move broadly similarly.) As you can see, Australia tends to outperform when industrial metals’ prices are rising and vice versa.
Exhibit 2: Australian Equities Mirror Metals Prices
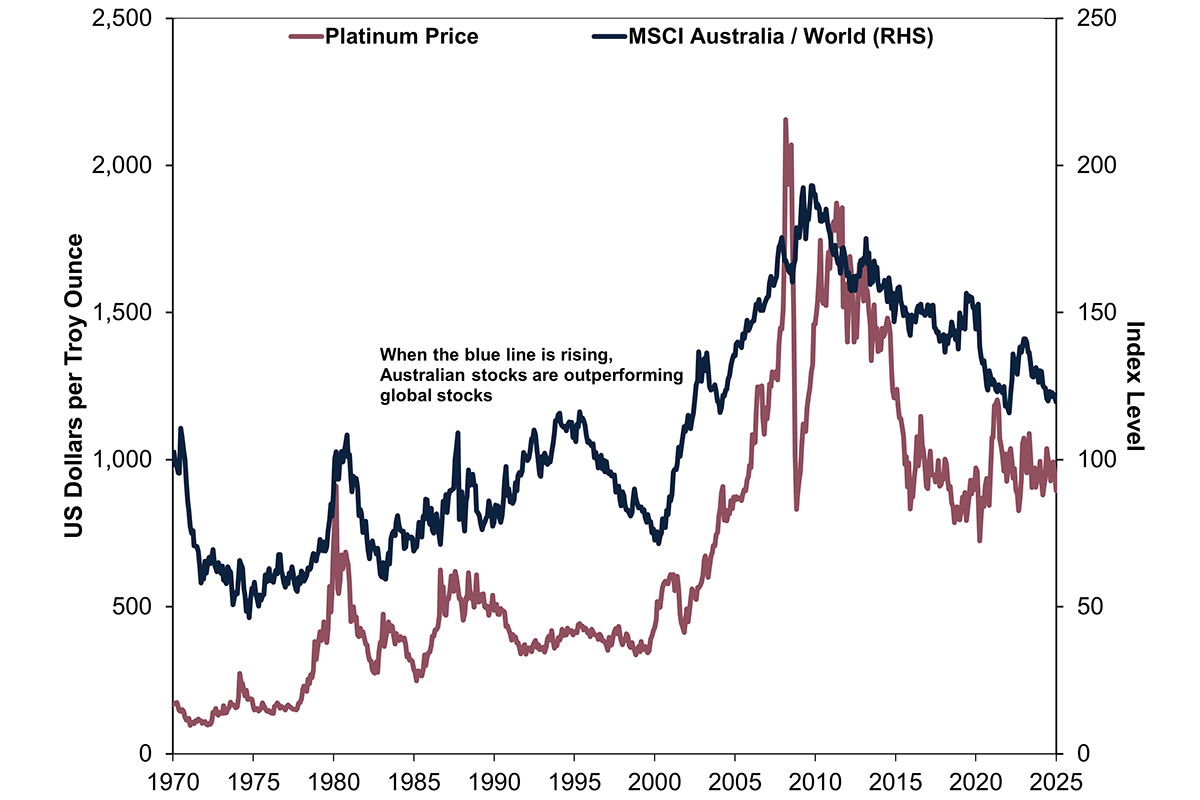
Source: FactSet, as of 15/1/2025. MSCI Australia and World Index returns with net dividends and platinum price per troy ounce, December 1969 – December 2024.
In the decade to 2010, when China’s economy emerged on the world stage with a seemingly inexhaustible demand for commodities to feed its burgeoning manufacturing base, Australian Miners – and in turn Australia’s equity market – benefitted.[ix] We think it stands to reason that if global metals demand picks up again, supporting rising commodity prices, that Australia would be in position to outperform.
Every sector – and country – has its day in the sun and rain. Understanding why highlights the risks and opportunities. When Fisher Investments UK reviews Australia’s case, we find leadership rotation keys off the yield curve and metals prices. Global investors do better digging down below the surface, in our view.
Get exclusive stock market knowledge in your Markets Commentary guide as the first of our ongoing insights.
Follow the latest market news and updates from Fisher Investments UK:
This document constitutes the general views of Fisher Investments UK and should not be regarded as personalised investment or tax advice or a reflection of client performance. No assurances are made that Fisher Investments UK will continue to hold these views, which may change at any time based on new information, analysis or reconsideration. Nothing herein is intended to be a recommendation or forecast of market conditions. Rather, it is intended to illustrate a point. Current and future markets may differ significantly from those illustrated here. In addition, no assurances are made regarding the accuracy of any assumptions made in any illustrations herein. Fisher Investments Europe Limited, trading as Fisher Investments UK, is authorised and regulated by the UK Financial Conduct Authority (FCA Number 191609) and is registered in England (Company Number 3850593). Fisher Investments Europe Limited has its registered office at: Level 18, One Canada Square, Canary Wharf, London, E14 5AX, United Kingdom. Investment management services are provided by Fisher Investments UK’s parent company, Fisher Asset Management, LLC, trading as Fisher Investments, which is established in the US and regulated by the US Securities and Exchange Commission.
Investment management services are provided by Fisher Investments UK’s parent company, Fisher Asset Management, LLC, trading as Fisher Investments, which is established in the US and regulated by the US Securities and Exchange Commission. Investing in financial markets involves the risk of loss and there is no guarantee that all or any capital invested will be repaid. Past performance neither guarantees nor reliably indicates future performance. The value of investments and the income from them will fluctuate with world financial markets and international currency exchange rates.
[i] Source: FactSet, as of 15/1/2025. GDP is a government measure of economic output.
[ii] Source: FactSet, as of 15/1/2025.
[iii] “Has Australia Really Had a 28-Year Expansion?” Paulina Restrepo-Echavarría and Brian Reinbold, Federal Reserve Bank of St. Louis, 26/9/2019.
[iv] Source: FactSet, as of 15/1/2025. Statement based on MSCI Australia Index returns with net dividends, 1/11/2007 – 6/3/2009.
[v] Source: FactSet, as of 15/1/2025.
[vi] Source: FactSet, as of 15/1/2025, and “Australia’s Experience in the Global Financial Crisis,” Christine Brown and Kevin Davis, University of Melbourne, 24/5/2010.
[vii] Source: FactSet, as of 15/1/2025. Statement based on MSCI Australia Financials earnings per share, June 2008 – June 2009.
[viii] Source: FactSet, as of 15/1/2025.
[ix] Source: FactSet, as of 15/1/2025.