
With eurozone GDP (gross domestic product, a government-produced estimate of national economic output) growth slowing in Q3, our survey of financial media publications turned up many worries the European Central Bank’s (ECB’s) mid-December decision to end its quantitative easing (QE) programme is ill-timed.i Through QE, the ECB buys long-term government and corporate debt securities from banks, in hopes this will give banks more money to lend and reduce long-term interest rates, stimulating demand for loans and thus boosting loan growth and economic growth. If this programme ceases, doesn’t that increase eurozone economic risks? In our view, no. Contrary to a running theme we find in media, we think the ECB’s exit from QE should help, not hurt, the eurozone’s economy—a potential positive surprise for eurozone shares.
We think the UK and US economies’ experiences during and after their central banks’ QE programmes illustrate this point. The Bank of England used QE from March 2009 through November 2012. During this span, growth in non-financial lending to households and businesses slowed and turned negative year-over-year in November 2010, declining over the next two-plus years.ii Broad money supply growth, as measured by M4, also decelerated, flipping negative in October 2010 and falling -5.3% y/y in June 2012.iii We think constricting capital and money circulation hurt GDP, which dipped negative quarter over quarter in Q2 and Q4 2012.iv But after QE ended, things improved. Loan growth accelerated, becoming positive year over year by July 2013.v Broad money supply also recovered, returning to positive year-over-year growth in 2013.vi GDP has grown in every quarter since Q1 2013.vii
In the US, the Federal Reserve (Fed) began QE in January 2009. In mid-2013, Ben Bernanke, who headed the central bank at the time, hinted that the Fed could soon begin reducing monthly asset purchases. That reduction, known colloquially as tapering QE, began in January 2014. The Fed reduced its monthly purchases regularly that year, finally ceasing them outright in October. US economic growth accelerated during 2014.viii Loan and money supply growth followed a similar pattern to the UK’s QE experiment. US lending and M4 money supply fell for a long spell during QE, but they rebounded as QE ended.ix
We don’t think it is mere coincidence that the US and UK economies strengthened after QE ended. Our research suggests QE negatively affects banks and is much more likely to hamper lending than to stimulate it. Banks generally extend loans only when profit margins make the risk worthwhile, a factor largely determined by the yield curve (or spread). The yield curve is a representation of bond yields from one issuer or issuer type arranged from shortest to longest maturities. Because banks’ funding costs are primarily short-term (for example, paying interest on demand deposits and overnight borrowing) and they typically make loans on a long-term basis, the more long-term interest rates exceed short-term rates, the more profitable bank lending is, encouraging lending. By buying large amounts of eurozone assets, we think the ECB’s QE programme lowered long-term interest rates, but it also flattened the yield curve—narrowing the spread between short- and long-term interest rates. This discouraged banks from lending, in our view, stifling economic growth rather than stimulating it.
From our standpoint, the ECB tapering its asset purchases over the last two years has helped lift long-term interest rates, lending and growth. In December 2016, the ECB first signalled its plan to reduce average monthly asset purchases from €80 to €60 billion the following April. Another reduction—from €60 to €30 billion—took effect in January 2018, followed by October’s to €15 billion. This tapering has coincided with the ECB’s eurozone yield curve steepening. Whilst there is no collective eurozone debt, the ECB tracks an average of euro countries’ yields to calculate a curve as a proxy. Whilst imperfect, we think it is a helpful, concise illustration of tapering’s impact. From the day before the ECB first broached tapering to early December, the eurozone yield curve spread (10-year yield minus 3-month yield) steepened slightly from 1.58 percentage points to 1.62 percentage points. (Exhibit 1) Loan growth accelerated from 2.2% y/y in November 2016 to 3.3% in October 2018, which continues the upward trend that began in 2014. (Exhibit 2)
Exhibit 1: Eurozone Yield Curve Steepened as ECB Tapered
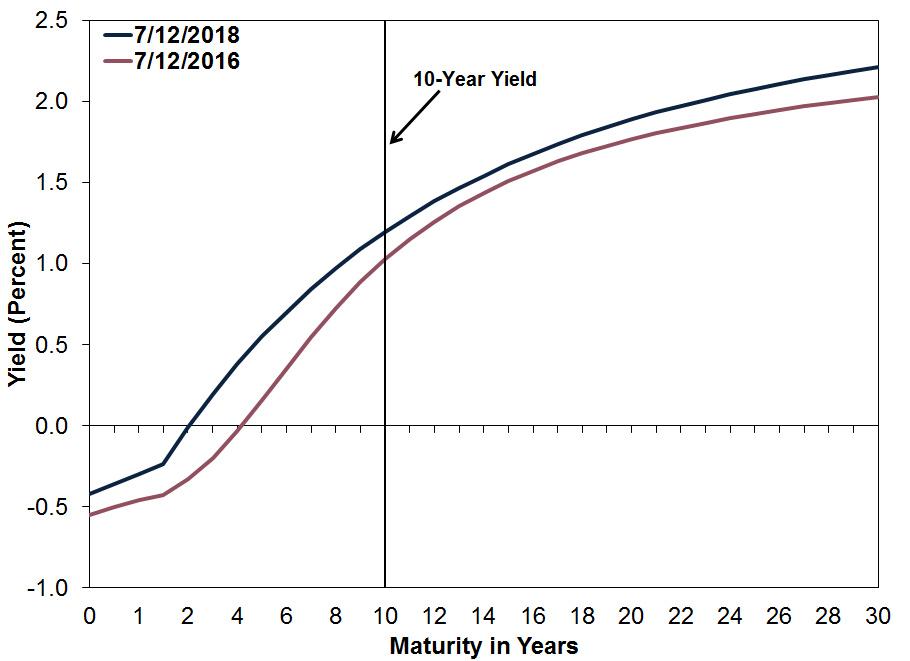
Source: ECB, as of 10/12/2018. ECB “all bonds” yield curve on 7/12/2016 and 7/12/2018. The ECB announced its first asset purchase reduction on 8/12/2016.
Exhibit 2: Loan Growth Has Accelerated
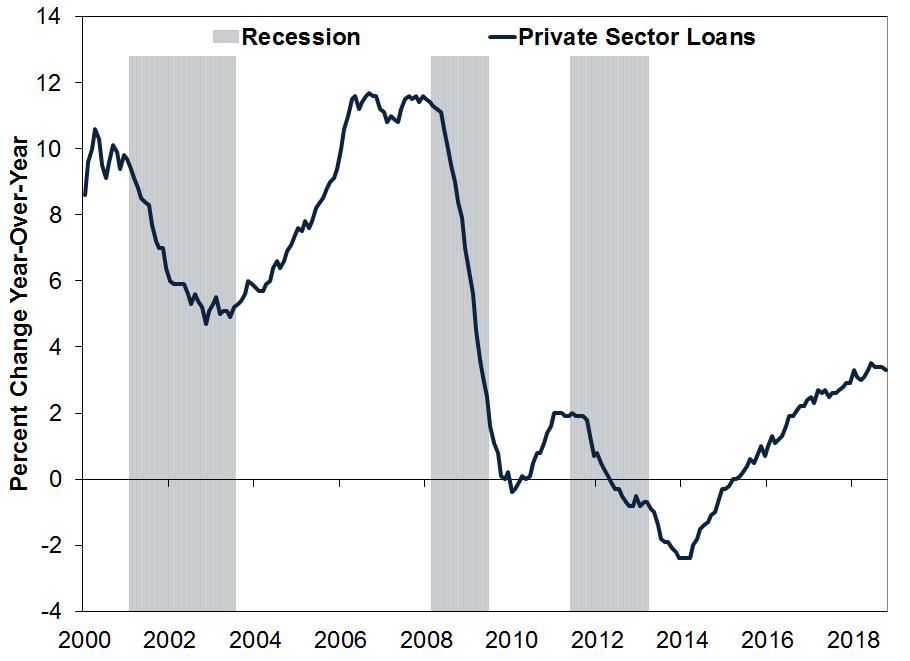
Source: ECB, as of 28/11/2018. Private sector adjusted loans (i.e. adjusted for loan sales, securitisation and notional cash pooling), January 2000 – October 2018.
Despite the “stimulus” narrative, loan growth’s acceleration as the ECB has reduced asset purchases shows tapering hasn’t hurt. The ECB’s latest Q3 bank lending survey also points to easing credit standards and financial institutions’ increased willingness to lend.x Rising business and household demand for and access to credit should continue driving broad economic growth.xi
In December, the ECB officially announced QE’s end beginning 2019. With its “non-standard monetary policy measures” completed, returning to normal should allow people to get over (false, in our view) fears of the ECB’s QE propping up the eurozone economy. If QE ends and the eurozone economy doesn’t contract, investors should realise the economy doesn’t need the ECB’s “support.” We think this would give investors more confidence, improve sentiment and boost eurozone equities. In our view, negative sentiment surrounding QE’s end and its positive impact in reality likely presents a bullish disconnect—and opportunity—for investors.
Follow the latest market news and updates from Fisher Investments UK:
On Facebook @FisherInvestUK
On Twitter @FisherInvestmentsUK
On LinkedIn
Fisher Investments Europe Limited, trading as Fisher Investments UK, is authorised and regulated by the UK Financial Conduct Authority (FCA Number 191609) and is registered in England (Company Number 3850593). Fisher Investments Europe Limited has its registered office at: 2nd Floor, 6-10 Whitfield Street, London, W1T 2RE, United Kingdom.
Investment management services are provided by Fisher Investments UK’s parent company, Fisher Asset Management, LLC, trading as Fisher Investments, which is established in the US and regulated by the US Securities and Exchange Commission.
Investing in financial markets involves the risk of loss and there is no guarantee that all or any capital invested will be repaid. Past performance neither guarantees nor reliably indicates future performance. The value of investments and the income from them will fluctuate with world financial markets and international currency exchange rates.
iSource: Eurostat, as of 11/12/2018. Eurozone real GDP, Q3 2018.
iiSource: Bank of England, as of 14/12/2018. Net lending to private non-financial corporations and household sector, November 2010.
iiiIbid. M4, October 2010 and June 2012. M4 money supply includes currency in circulation, private-sector deposits, certificates of deposit, commercial paper and bank bills.
ivSource: Office for National Statistics, as of 14/12/2018. UK real GDP, Q2 2012 and Q4 2012.
vSource: Bank of England, as of 14/12/2018. Net lending to private non-financial corporations and household sector, July 2013.
viIbid. M4, May 2013.
viiSource: Office for National Statistics, as of 14/12/2018. UK real GDP, Q1 2013 and Q3 2018.
viiiSource: Bureau of Economic Analysis, as of 11/12/2018. US real GDP, Q1 2014 – Q4 2014.
ixSource: Federal Reserve Bank of St. Louis and Center for Financial Stability, as of 14/12/2018. Loans and Leases in Bank Credit, All Commercial Banks and Divisia M4 Including Treasuries, January 2009 – December 2014.
xECB Bank Lending Survey, as of 22/10/2018. Net percentage of banks reporting easing terms and conditions for loans or credit lines to enterprises and households, Q3 2018.
xiIbid. Net percentage of banks reporting greater access to credit and demand for credit, commercial & industrial loans and mortgage Loans, Q3 2018.